Design Thinking with AI
Nov 27, 2017
3 min read

Design Thinking with AI
I want to share some lessons around how my team has adapted IBM Design Thinking to fit our needs and fulfill our mission developing AI prototypes and tackling SWAT opportunities. I’ve led & facilitated IBM Design Thinking workshops for executive-level clients, senior Watson leadership, IBM teams and external agencies. These workshops have led to co-creating user-focused experiences with clients that deliver impactful Watson integrations that solve a need for our users and have added capabilities for IBM Watson. During these workshops, I’ve identified a workflow that my team has used to design Watson Proof of Concept experiences and MVP prototypes that we’ve built leveraging the outputs of the exercises.
Looking beyond needs alone
The key to any successful Watson experience is making sure the objective based on user need — or data insight. This focus allows us to align core capabilities around the application that meet a necessity, not functionality. In the AI age, we need to move beyond needs alone — we have to develop trust and empathy within our experience to create a cooperative relationship between Watson and our users.
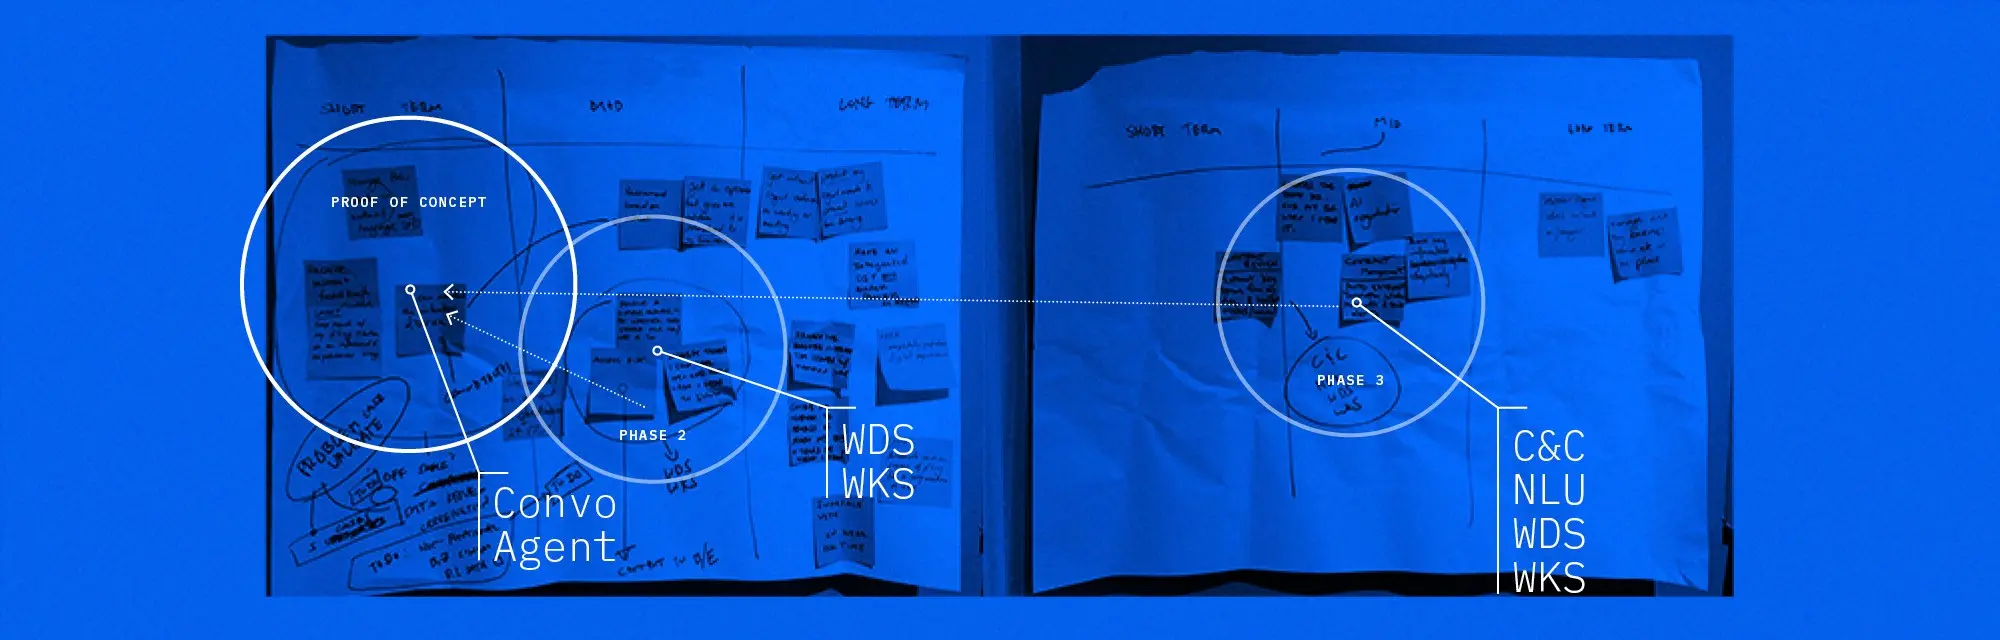
Identifying a Proof of Concept using Experience Based Roadmaps to identify key milestones and Watson integrations
Integrating Watson into Design Thinking
Watson can be incorporated into every Design Thinking exercise — but I’ve found it used best, with least influence over the concept, when integrated into activities after the initial brainstorming. That focuses our central thinking on our users — afterward we focus on determining how we can leverage Watson to meet those needs. We include client stakeholders & leads, Watson architects, data scientists, and developers, as well as our stakeholders and design leads. These folks work together to fulfill this part — I find it best to let our clients prioritize the direction on their own, and then we work on integrating Watson collectively.

Identifying our core experience using prioritization and designing data and insight we can find with Watson.
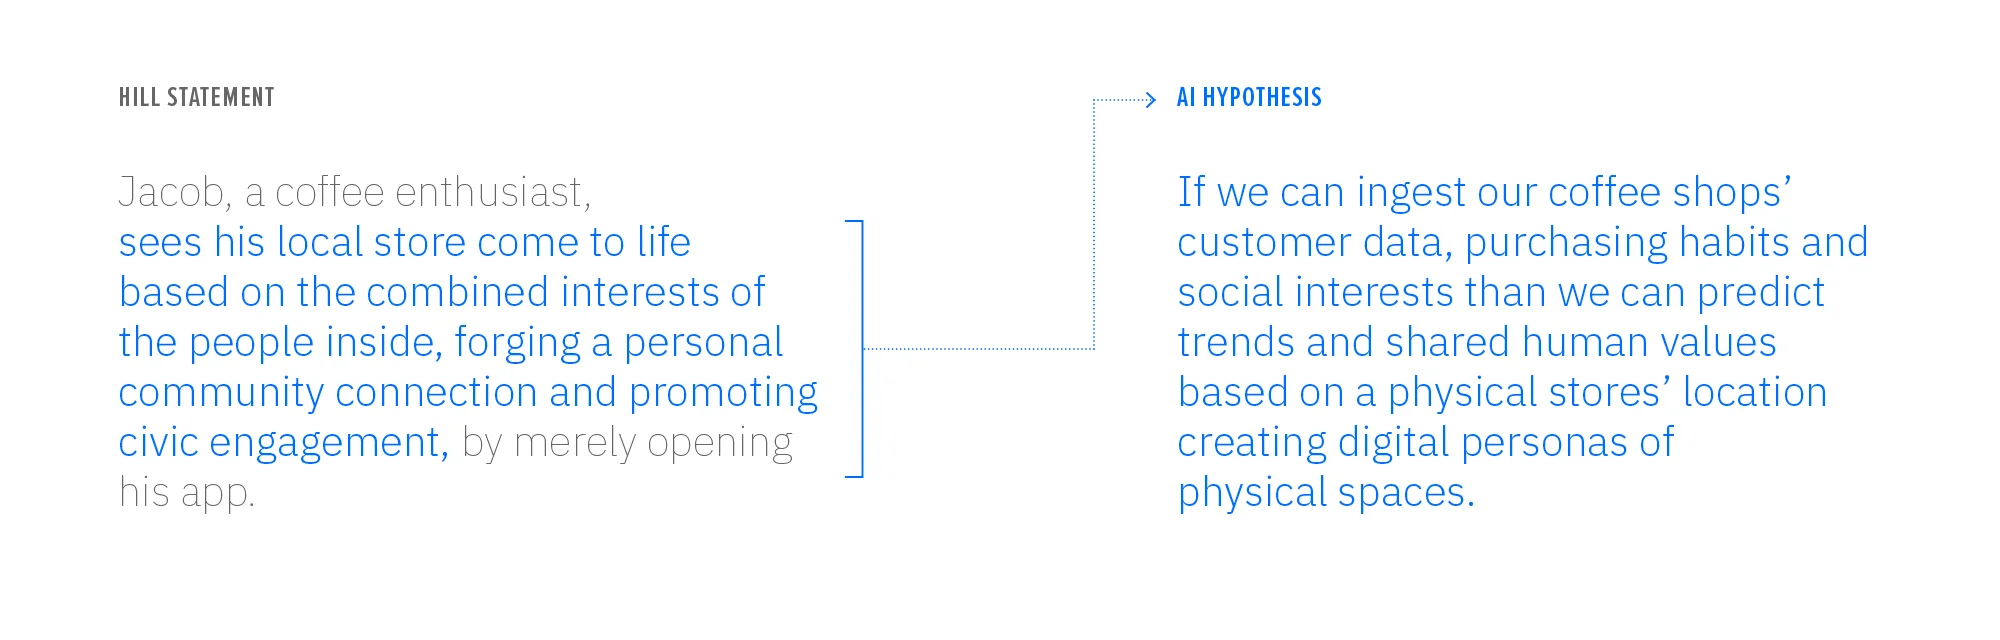
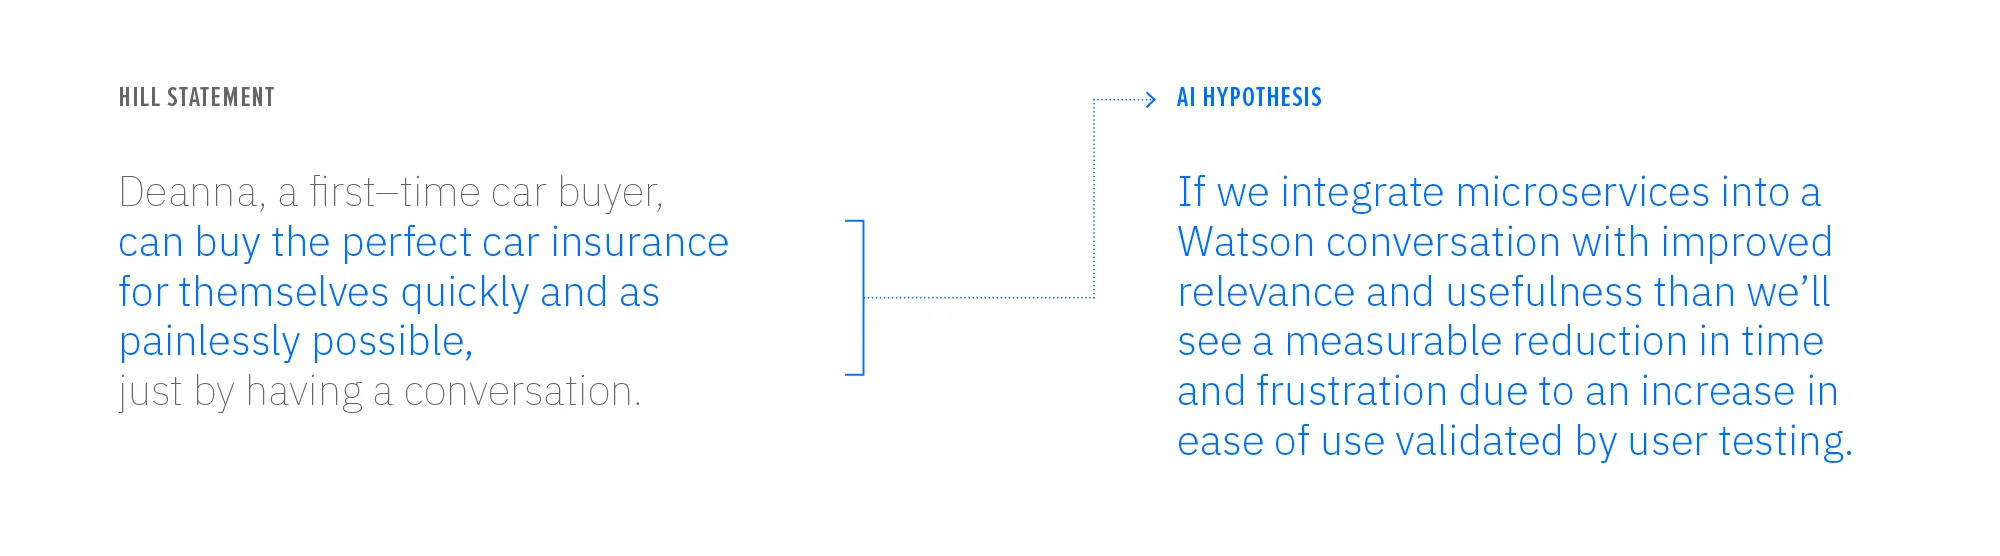
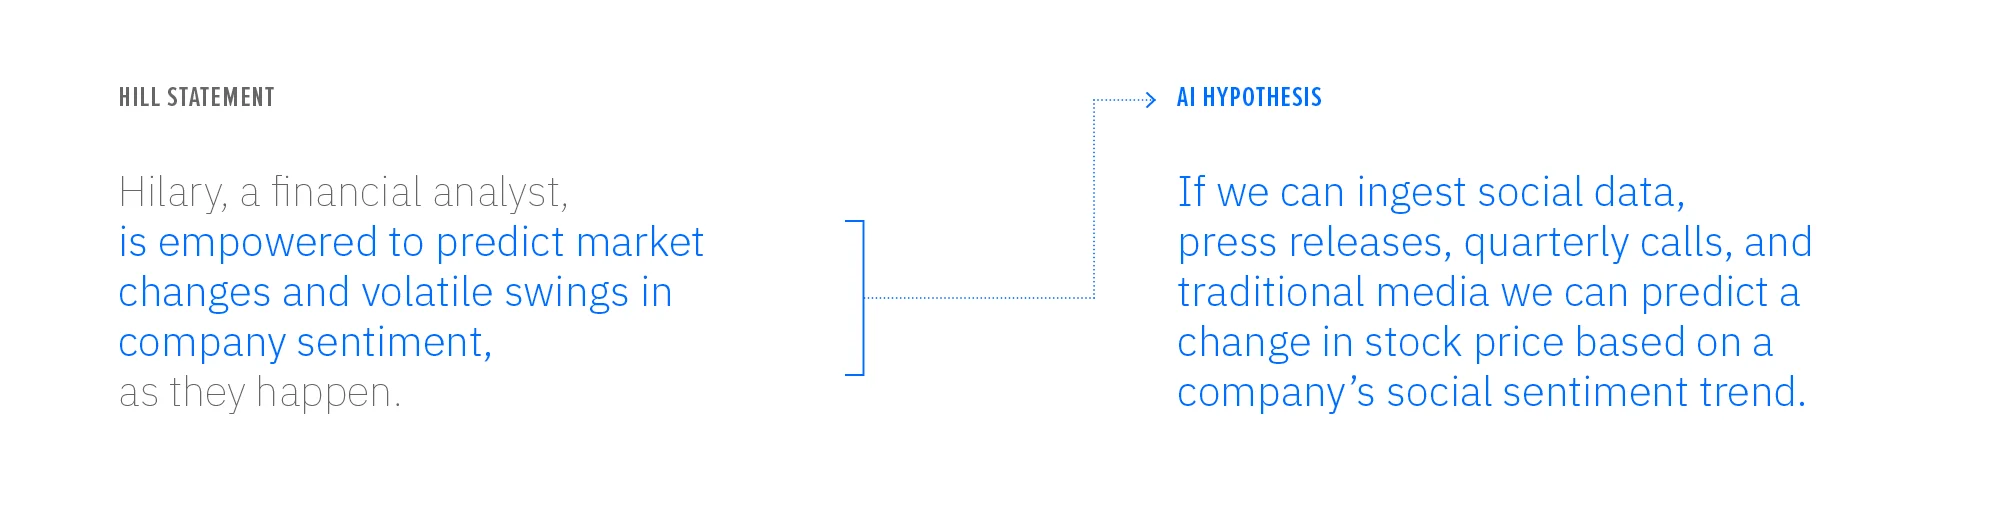
Forming a hypothesis
Our team’s goal walking out of any Design Thinking session with Watson is a precise definition of the experience — a Hill or commander’s intent matched with data and insights that form the building blocks of our application. We can take the output of the Design Thinking sessions and focus on what we discovered. The ‘what’ of our Hill statement is the seed basis for our data hypothesis — which will leverage the data we identified or deliver the insights we outlined.

Prototyping with Watson
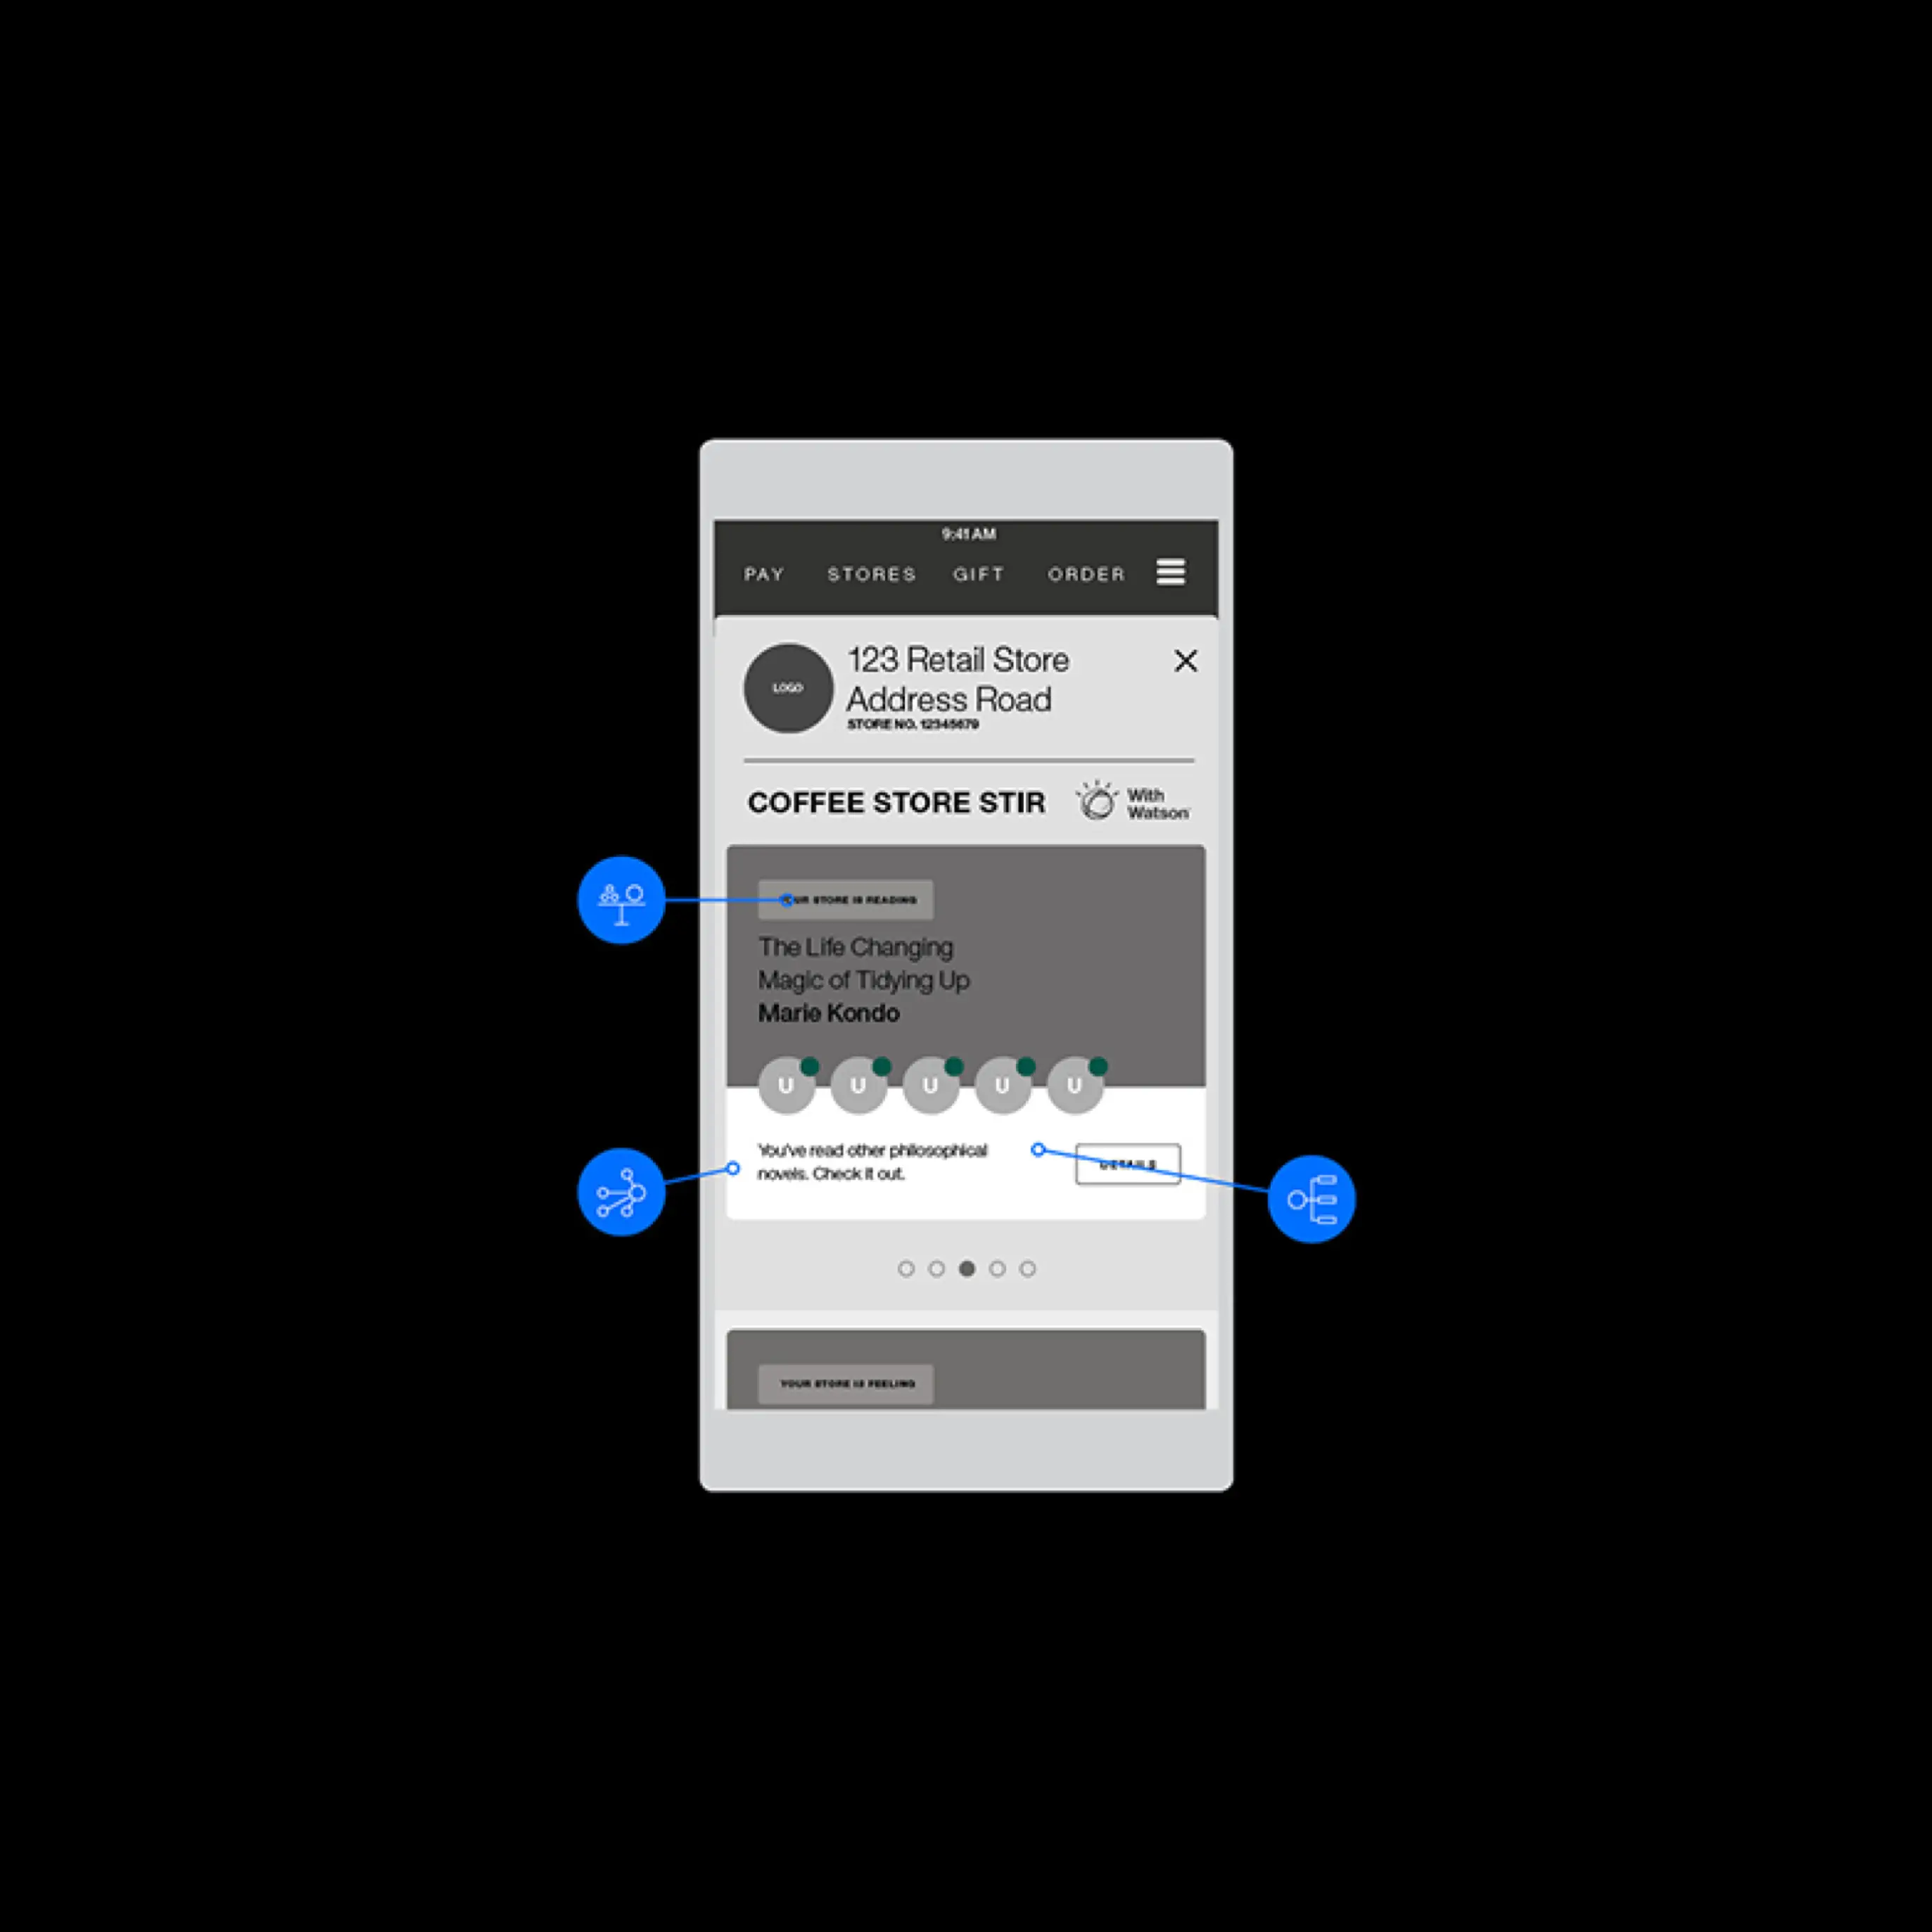
Using the Hill statement we defined in our workshop sessions, we start to prototype an experience built around the Hill’s core tenets. Functionality, technology, and AI decision are based entirely on achieving our hypothesis in context to our user.
This approach is appropriate for prototypes of all fidelities and levels of interaction. It gives our integrated teams common language and syntax to work with and makes the experience tangible for high-level client executives.
For every interaction, touchpoint, and pivot in our prototype we have to:
define what our user is doing
what data sources they’re accessing
what APIs Watson is using
how is it analyzing that data
how we make that data accessible
how that info helps our user make a decision and/or move forward
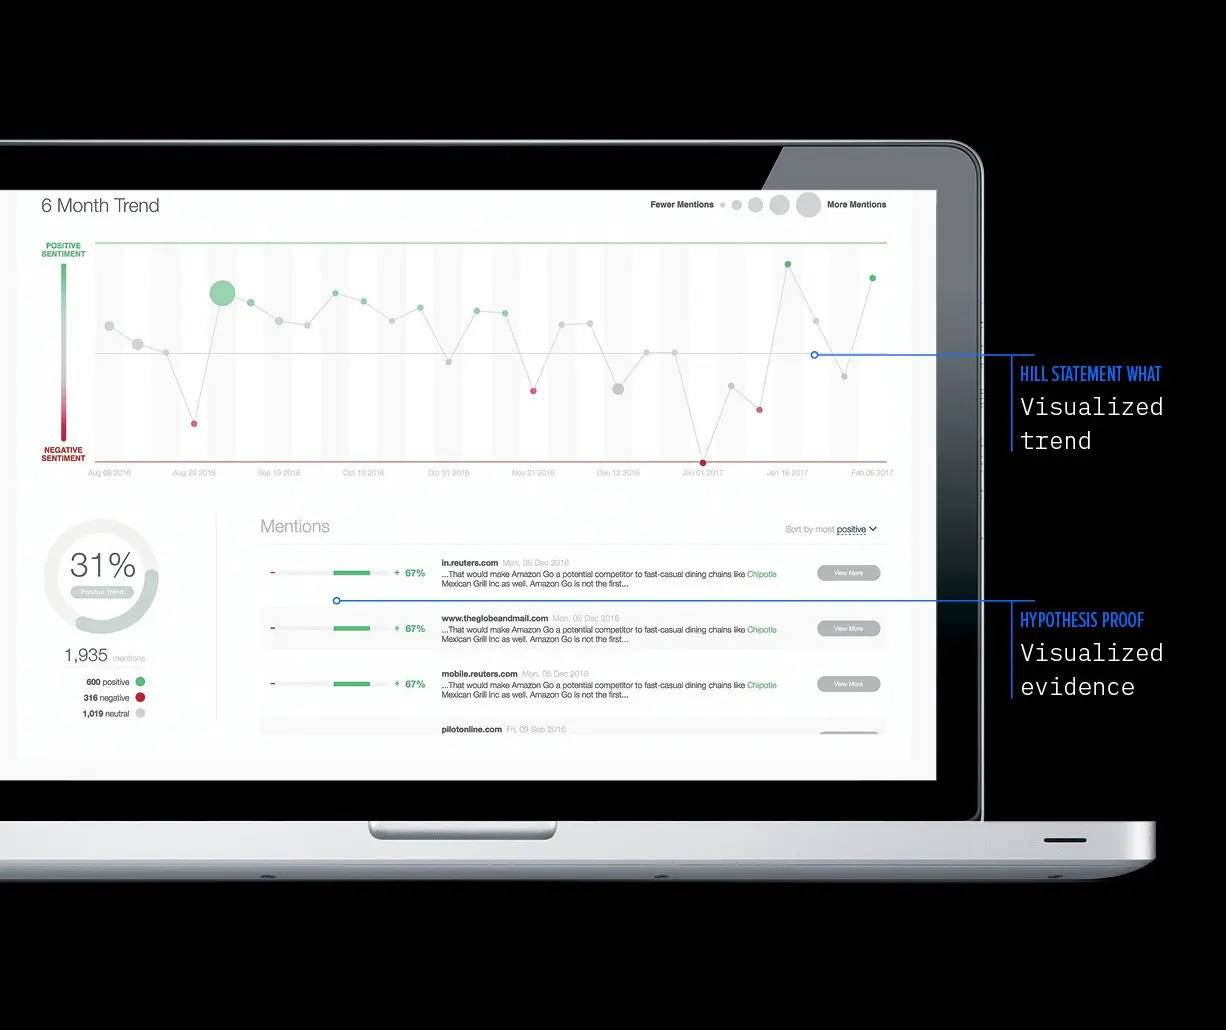
Visualizing your data insights
Combining all we learned during the Design Thinking process and the prototype phase allows us to develop the right visuals that add clarity for our users but also demonstrate what Watson is ‘doing,’ which adds trust to the relationship.
So, how do you prove your hypothesis visually?
Your experience may not require a data visualization but using the same thought process will help you ‘prove’ the decisions Watson made (i.e. ‘why is this recommended to me?’).

Validating and iterating
User testing will validate your experience against their needs which will map directly back to the Hill statement from the initial exploration. Validating Watson performance should be carried out with the user in mind — is this data valid, did it prove or disprove our hypothesis? Be iterative toward all phases of your design — a second aspect of data enrichment may prove your hypothesis and meet your user’s needs.
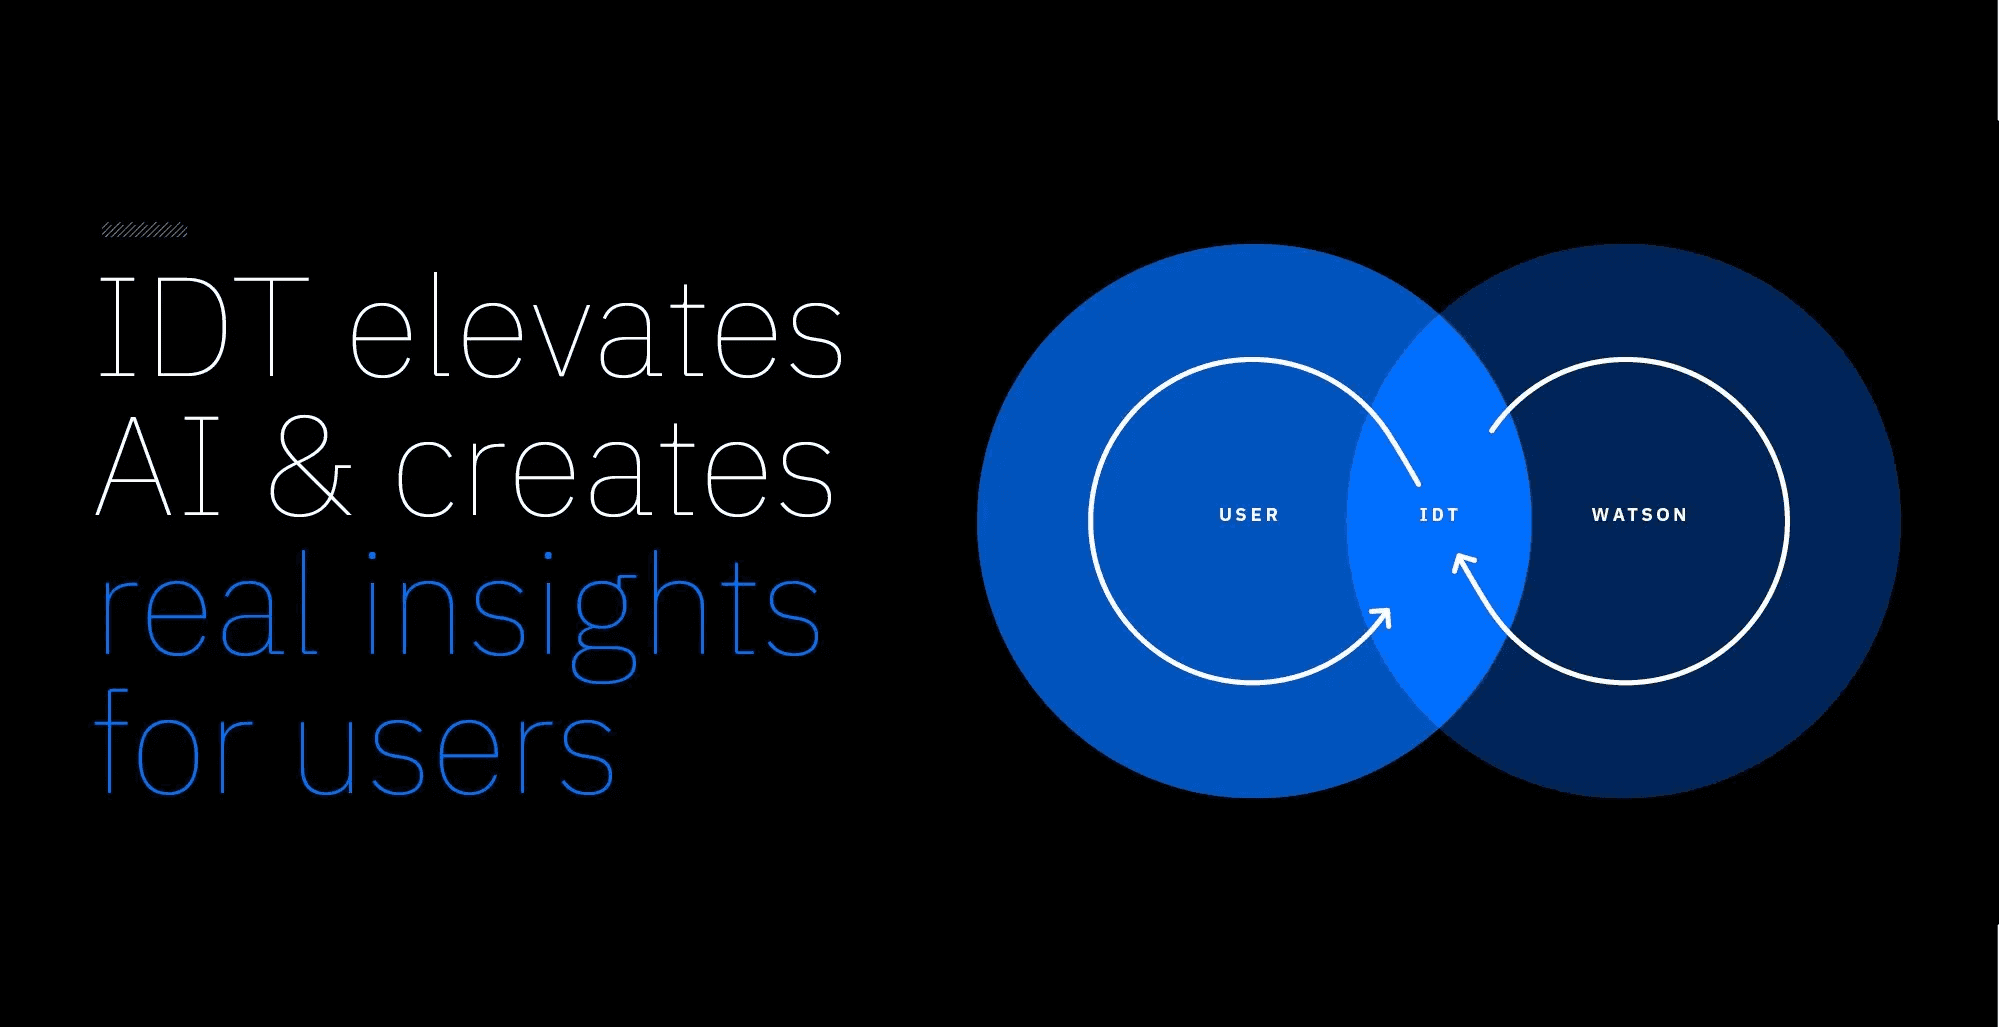
IBM Design Thinking elevates AI & creates real insights for users
—
This private publication is not affiliated with my employers or professional associations. Personal blog, personal opinions. Not speaking for anyone but myself. ✌️
Back
←
